Problem Statement
During the hard times of the Covid-19 pandemic the commencement of offline class seems to be the biggest challenge for VIT university especially that the students have to travel from different states of the country. This WebApp called “CoviCheck” aims to resolve the problem by giving daily updates on the number of active cases, recovered cases and the total deaths in the past 30 days throughout the country. The WebApp also has a pictorial representation of the cases in form of a line graph which would help the college management to figure out the trends and curves of Covid throughout the country in the past 1 month.
Features
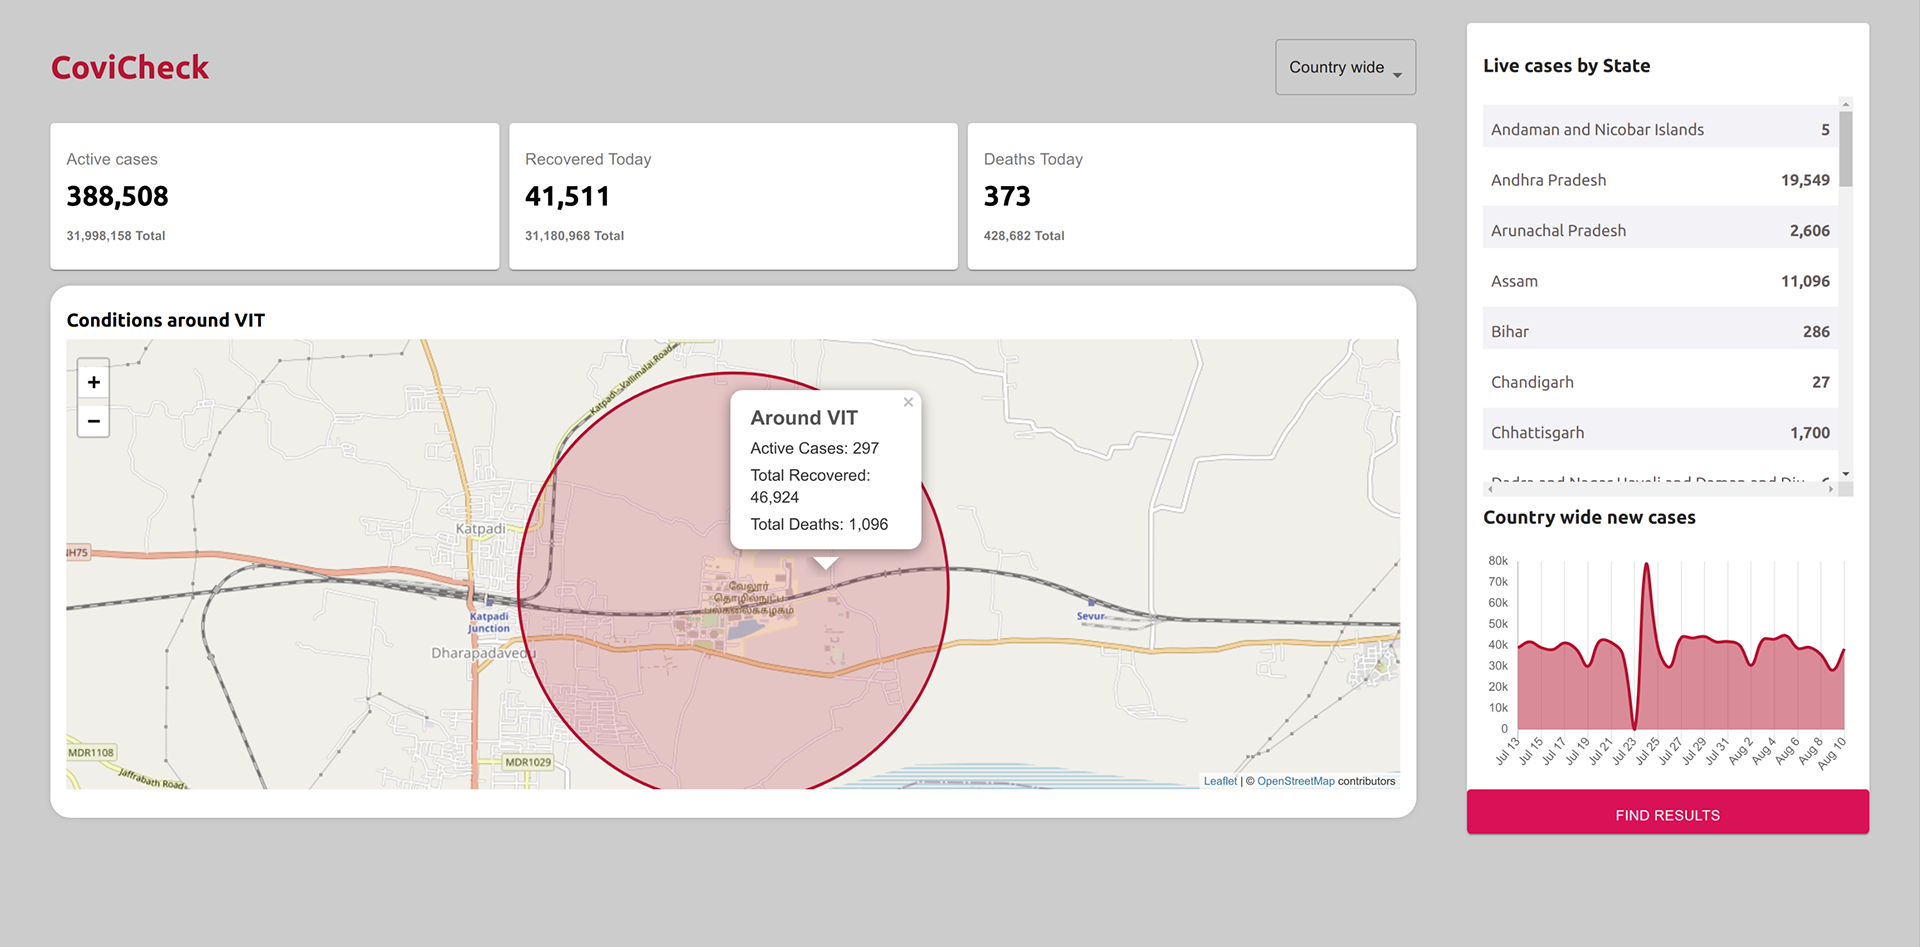
> State wise dropdown to fetch statistics for each state using Indian government's APIs
> A map component to display Covid 19 statistics around Vellore specifically.
> A line chart to visualize Covid 19 trends effectively.
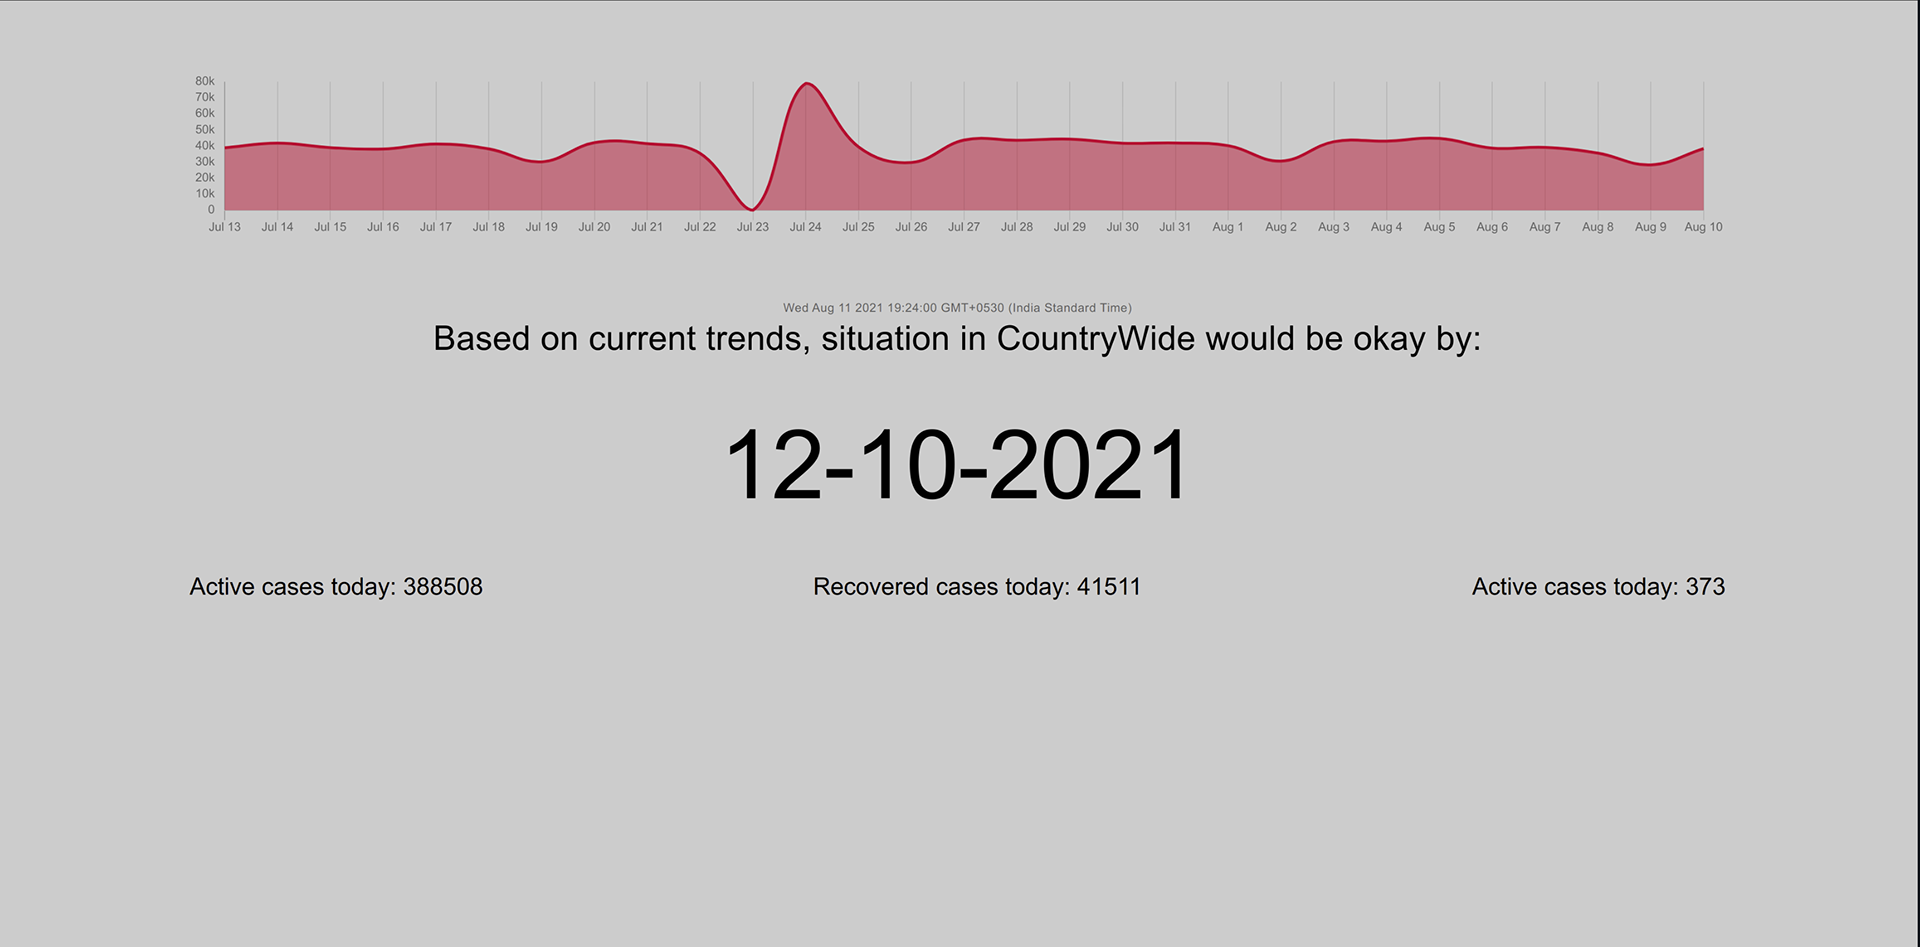
> A simple mathematical model to predict when the conditions will resolve to normal.
Tech Stack
React, Material UI, Chart JS
Source Code
Interface
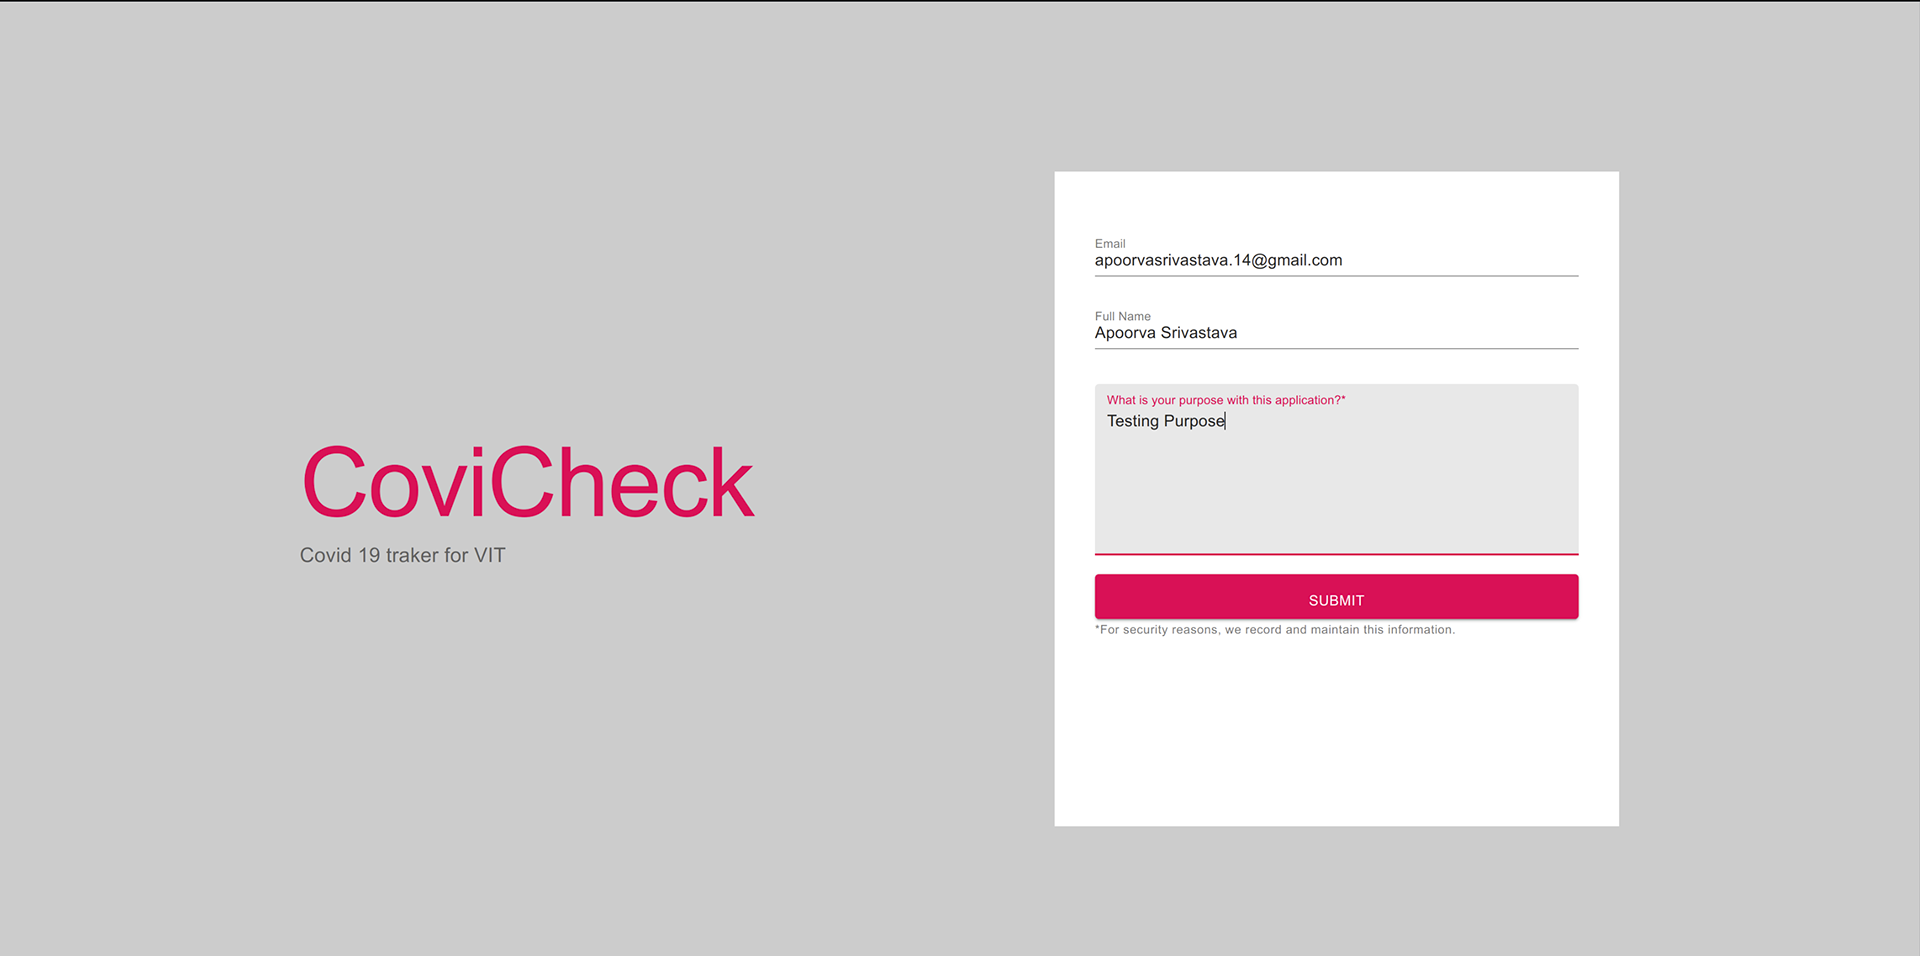
Landing Page
Dashboard
Predictions Page